Conversations and Quality
Two pages help you keep your agent sharp: Conversations shows every chat with a visitor, and Quality shows how well it is doing overall. Used together, they tell you what people ask, where your agent shines, and where your knowledge base needs a little more.
Conversations
Open Conversations in the sidebar to see every visitor chat. Filter by status (Active, Ended, Escalated), date, or keyword, or show only the ones you have flagged.

The Conversations page showing the outcome metrics strip, the filter chips, the CSV export button, and the conversation list with outcomes
Click any conversation to open it. You will see when it started, how it ended (Resolved, Escalated, Ended, Abandoned, or Active - Ended means the visitor left after your agent had answered; Abandoned means they left with a question still open), the visitor's email if they shared one, their city and timezone, and the full back-and-forth. If your agent searched your knowledge base or used a tool, you can expand it to see what it looked for. Your own chats with the built-in assistant while building the agent are not listed here - only conversations with the agent are.
As you review, you can:
- Flag a conversation that needs your team's attention
- Rate it 1-5 stars to track quality over time
- Add a note for internal context (visitors never see notes)
Quality
The Quality dashboard gives you the big picture. Open it at the /quality path on your dashboard, and pick the time range (7, 30, or 90 days) with the selector at the top right.
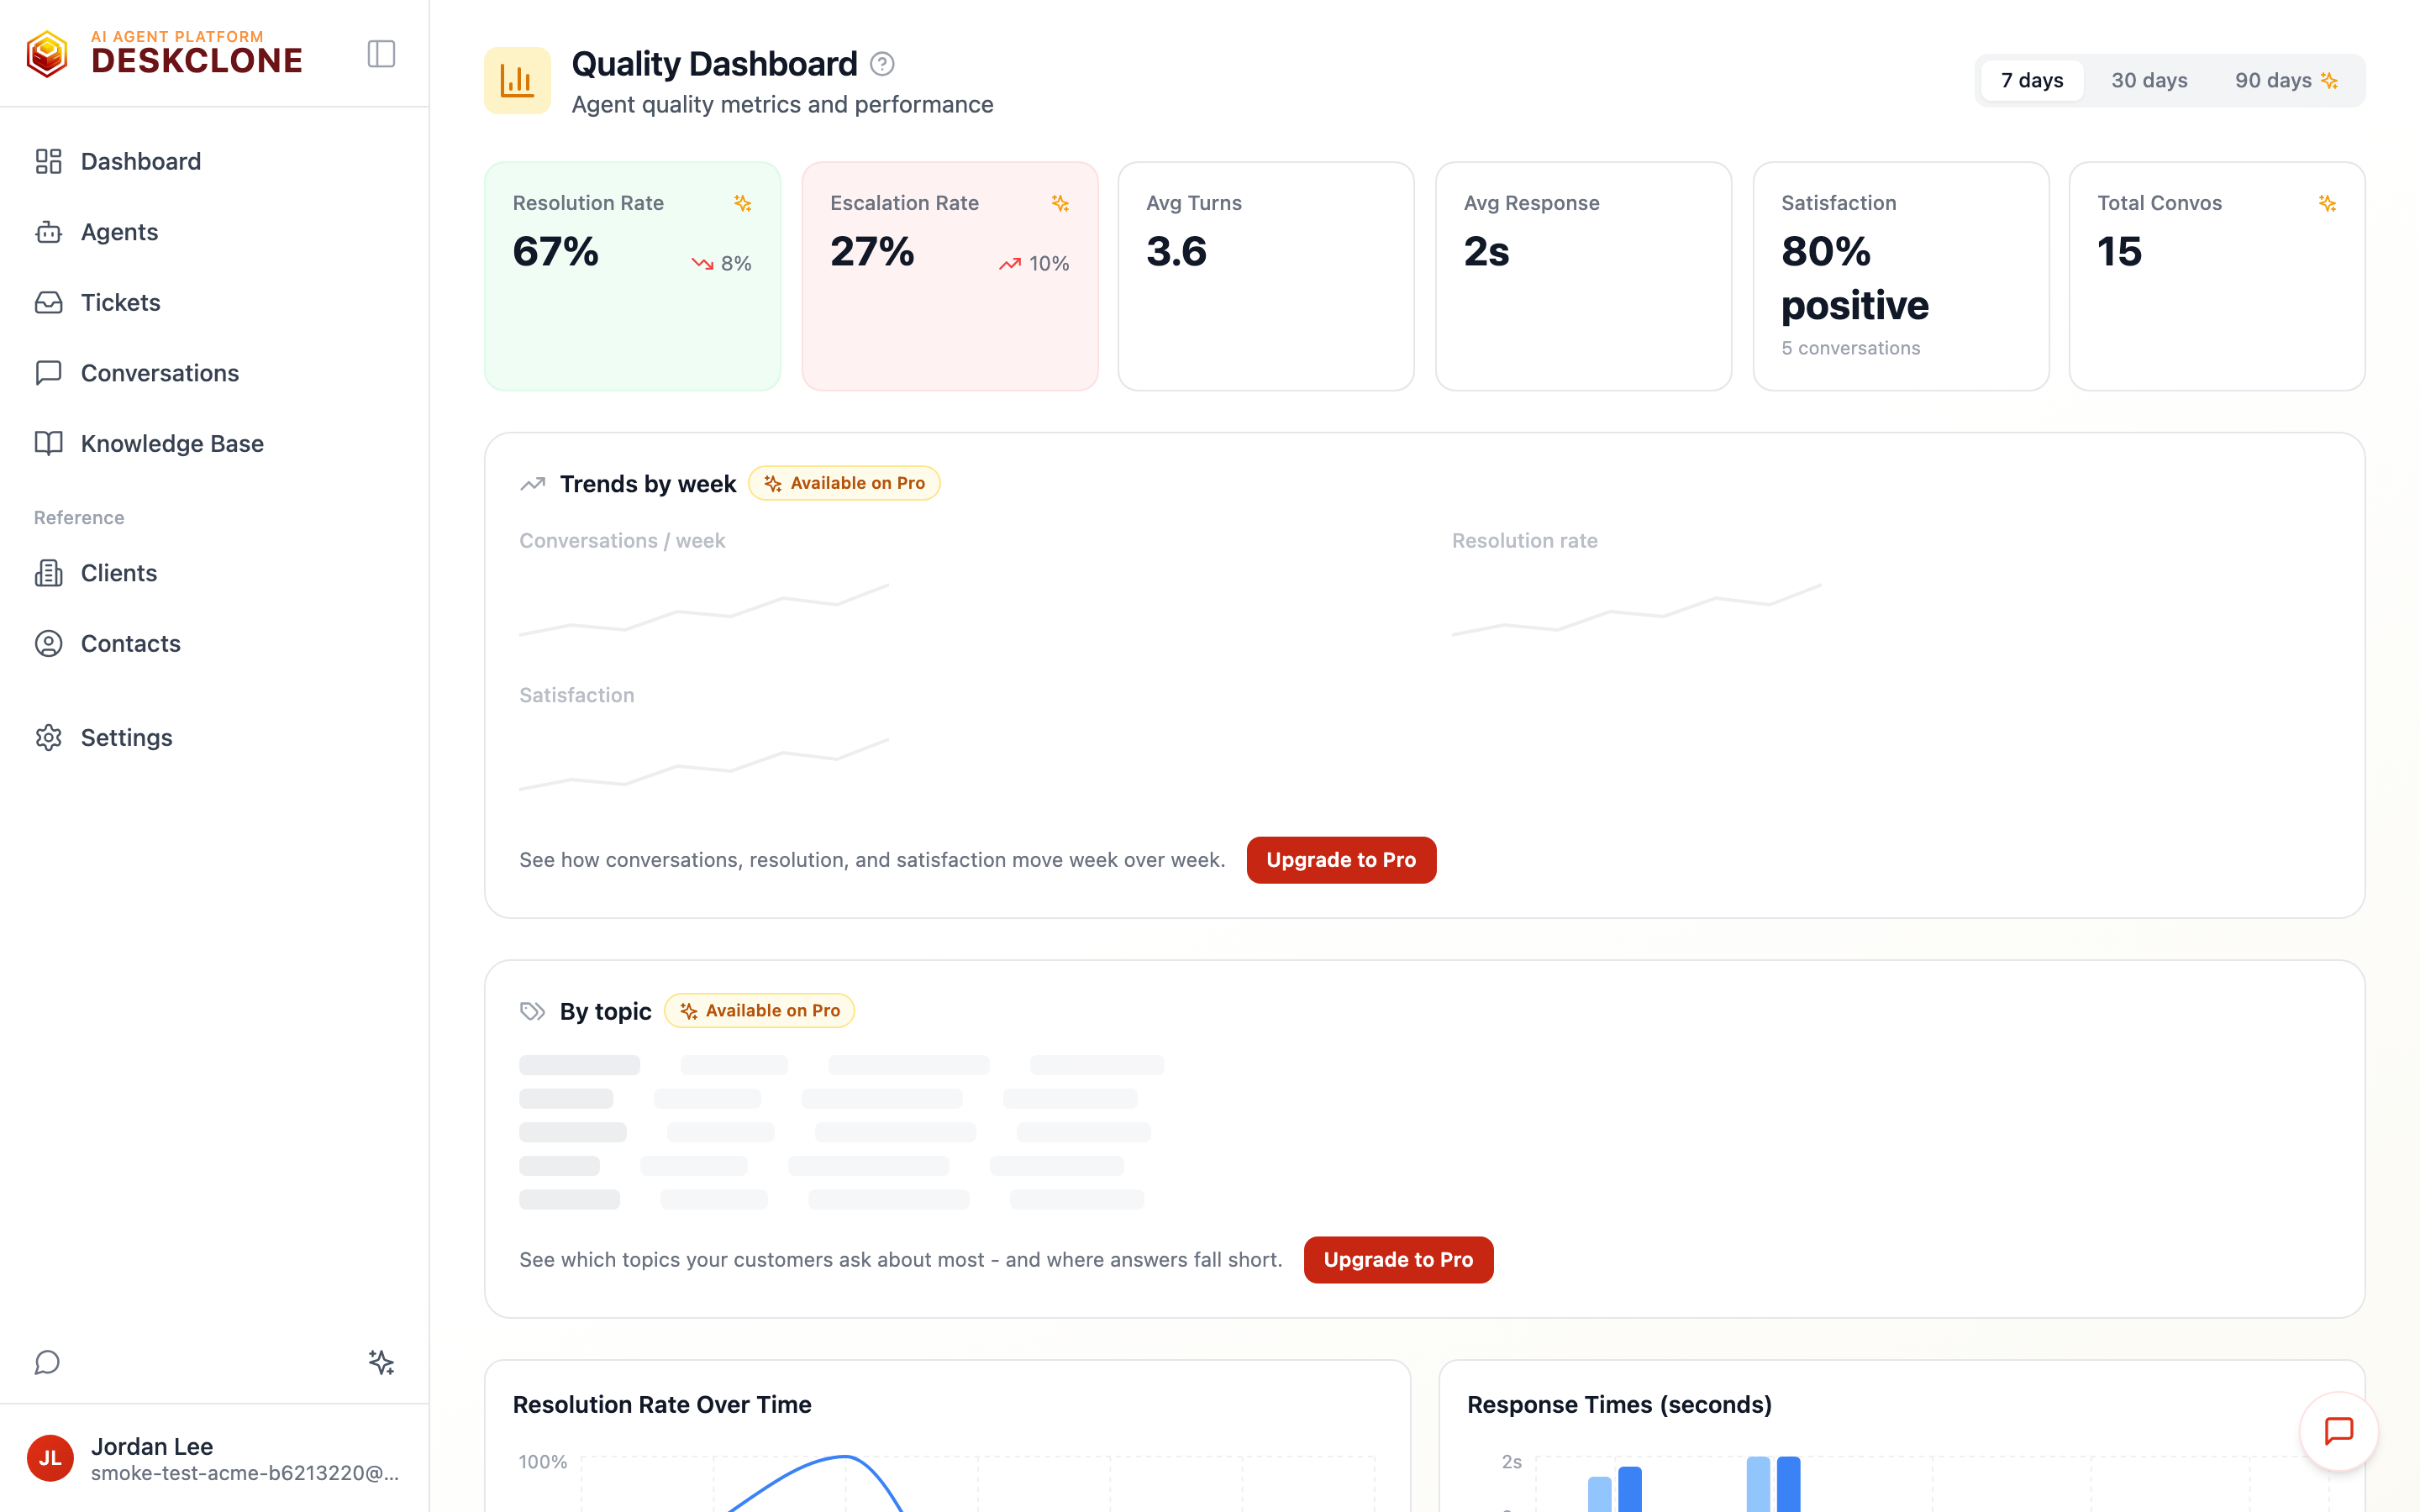
The Quality dashboard showing the headline metric tiles, the time range picker, the Trends by week panel with CSV export, and the By topic breakdown
The headline numbers:
- Resolution rate - how often your agent resolves a widget conversation on its own (resolved conversations out of all that finished). Above 70% is strong; below 50% usually means content gaps.
- Escalation rate - how often it hands off to a human. Some is healthy and expected.
- Average turns - how many messages it takes to get there. Fewer means quicker answers.
- Satisfaction - how visitors rated the answers with the thumbs in the chat, counted per conversation and shown as "94% positive · 17 conversations". A conversation counts as positive when its ratings are mostly thumbs-up.
With very few conversations the tiles show "Collecting data" instead of a percentage - a 0% or 100% computed from three chats would be noise, not truth. Rates appear once about ten conversations have finished; satisfaction appears once five conversations have been rated.
Seeing the conversations behind a number
On the Pro plan and above, the Resolution, Escalation, and Total tiles are clickable - each one opens the Conversations page pre-filtered to exactly the chats that number was computed from, so "78% resolved" is something you can inspect, not just read. The Trends by week panel below the tiles charts conversations, resolution rate, and satisfaction week over week, and the 90-day range unlocks with it. On other plans these show as locked previews with an upgrade path - never hidden, never fake numbers.
Topics (Pro)
The By topic panel on the Quality page breaks conversations down by what they were about - Billing, Technical, Account, Shipping, Returns, or General - with each topic's volume, resolution rate, and escalations. New conversations are categorized automatically overnight, so a topic's first numbers appear the day after the traffic. It is the quickest way to spot patterns like "billing questions escalate twice as often as everything else."
An Unclassified row collects conversations from before topic tracking started (older history is never re-processed) plus the rare chat that could not be categorized - it always stays in the totals, so the numbers you see add up. When one topic's resolution rate falls well below your average, the dashboard raises a suggestion pointing you at this view.
Exporting to CSV (Pro)
Three surfaces export as CSV files you can open in Excel or Google Sheets, or forward as-is:
- Conversations - the download button next to the refresh icon exports the list with your current filters applied (outcome, dates, search, and so on), including each conversation's topic. Very large result sets export the most recent 5,000 rows and the page tells you when that cap applied - narrow the date range to get the rest.
- Trends by week and By topic - the download button on each panel exports exactly the numbers the panel shows.
Exports contain the same data you can already see on the page - nothing more.
Quality Flags
DeskClone flags conversations worth a second look. These are helpful nudges, not failures:
- Possible inaccuracy - your agent may have said something your content does not clearly support. Usually a sign the topic needs better coverage.
- Visitor needed more help - signals the visitor was not fully satisfied (repeated questions, no clear ending).
- Repeated responses - your agent gave similar answers more than once, often because it could not tell follow-ups apart.
Flags are most common when you are new. Each one points at where your knowledge base can improve - as you add content in response, the flags fade.
Close the Gaps
The fastest way to raise your resolution rate is to fix what visitors ask about but your content does not cover. Go to Knowledge Base > Coverage Gaps to see those questions, ranked by how often they come up.
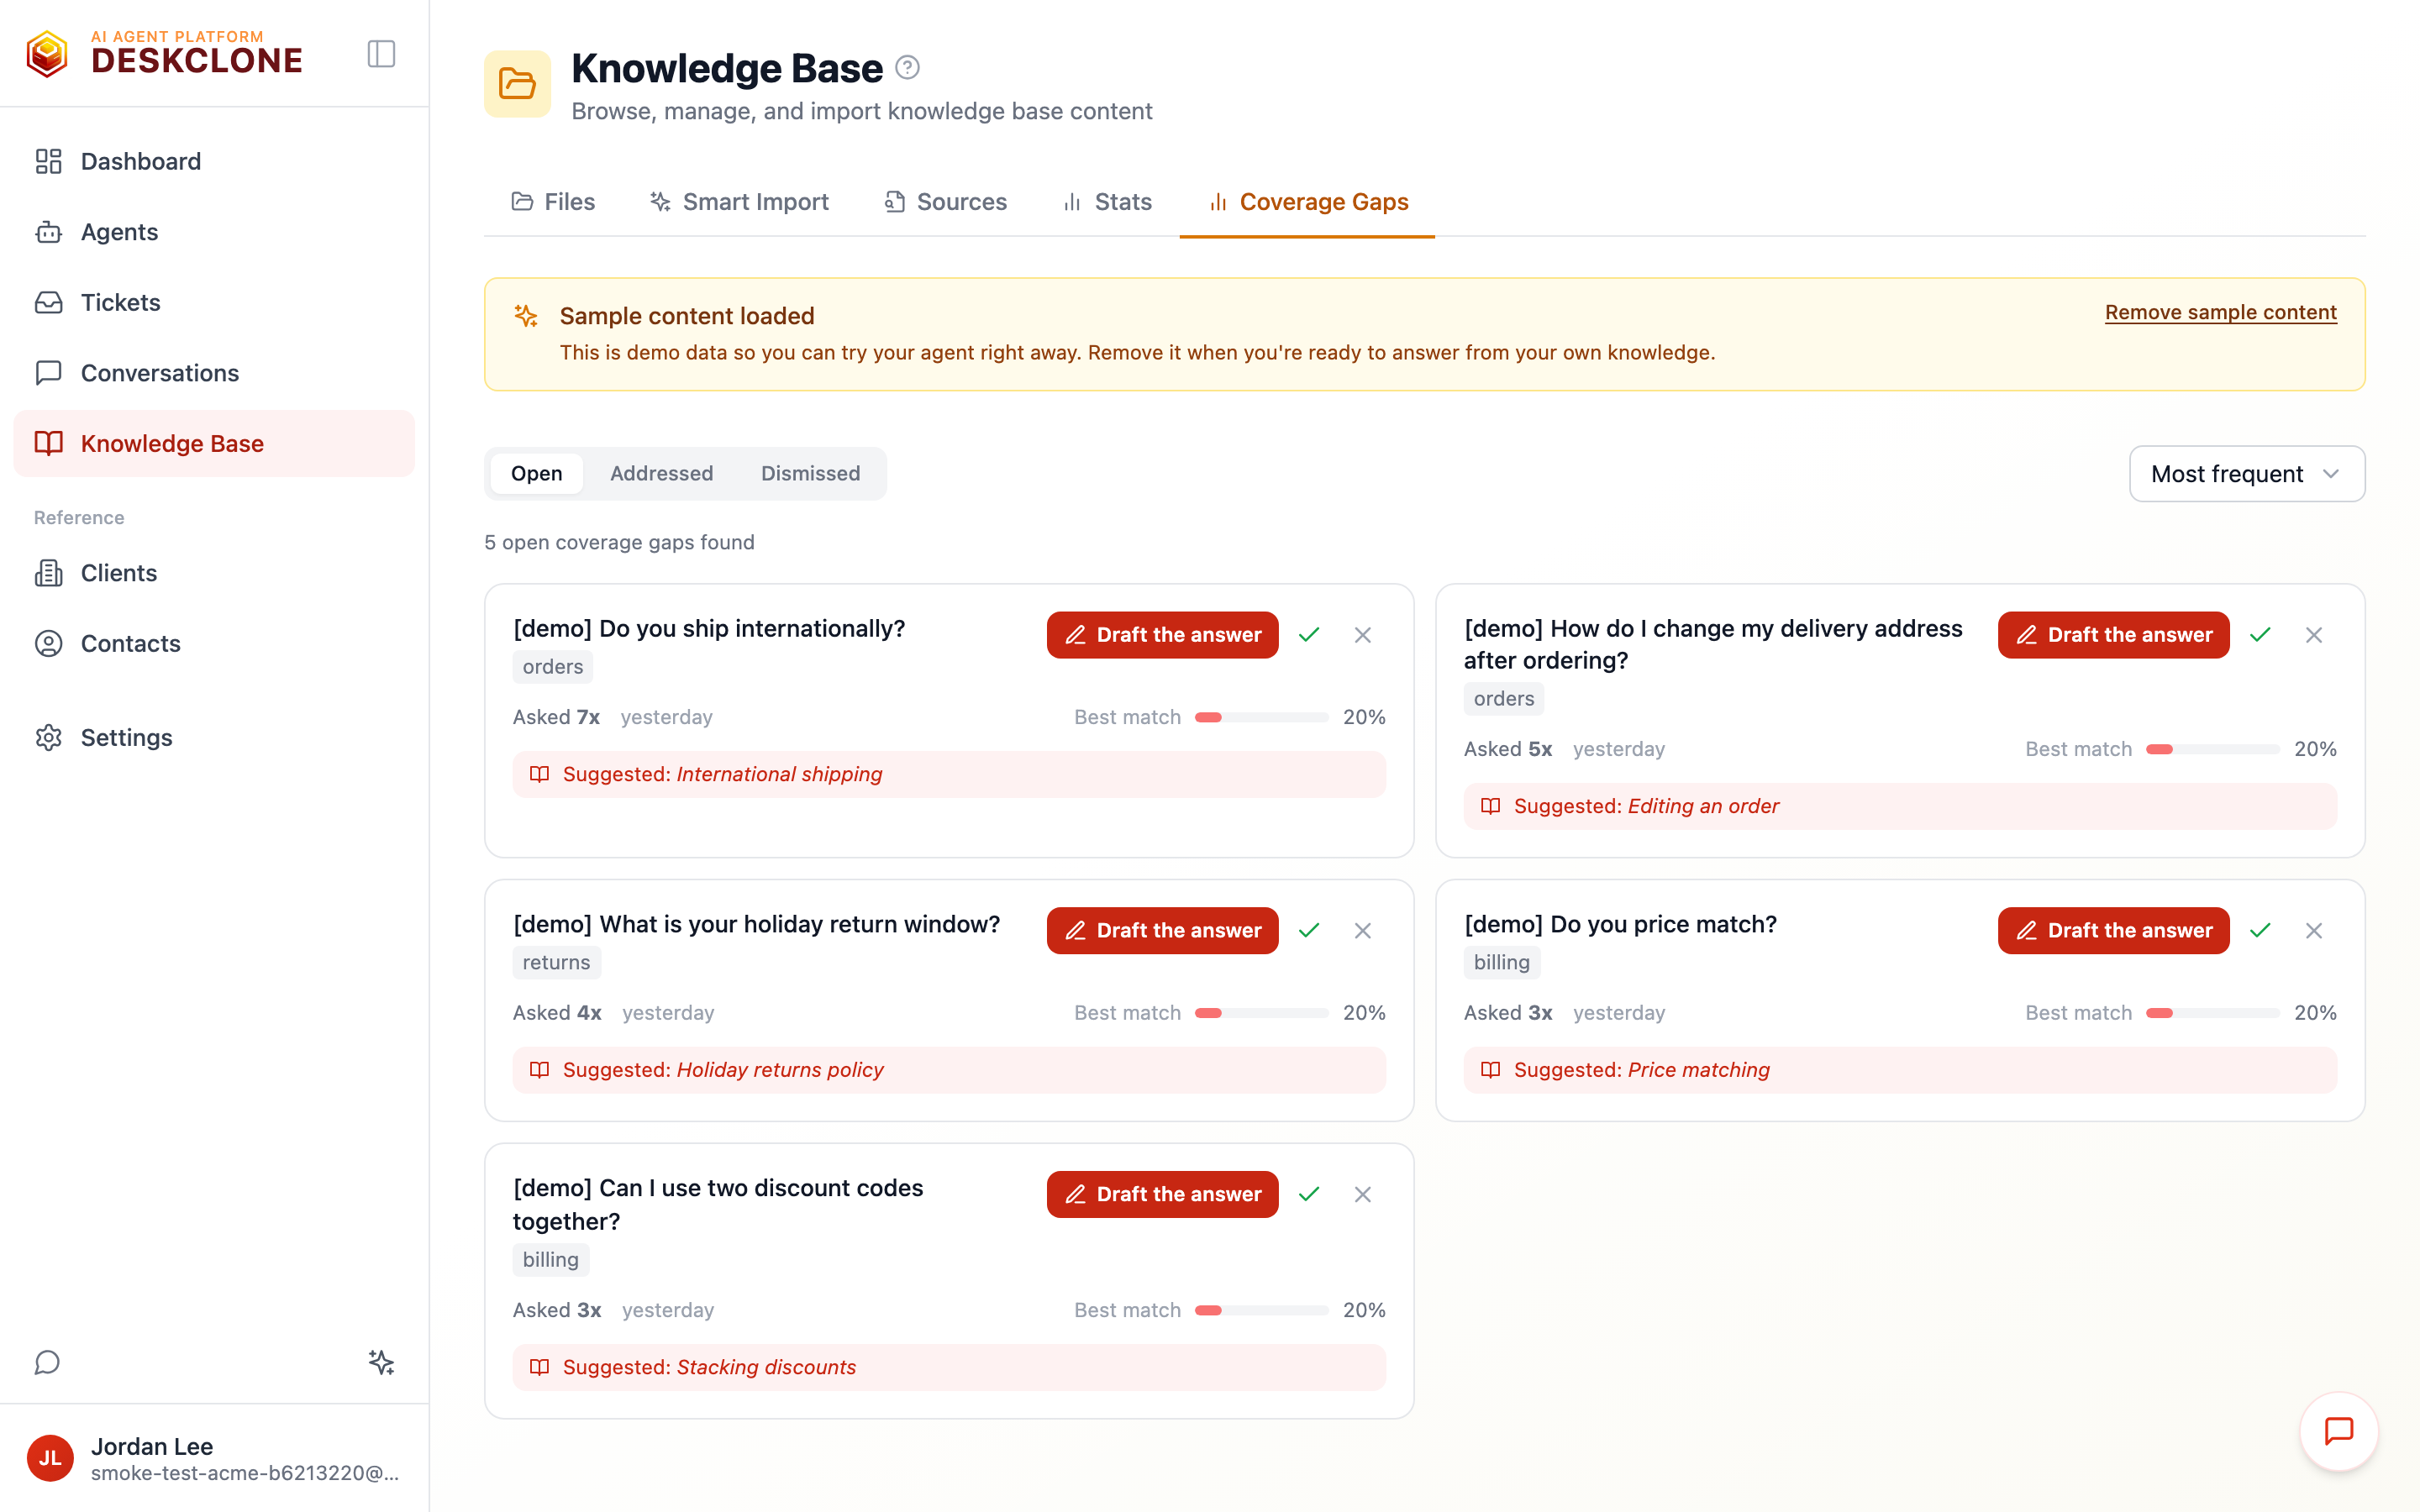
The Coverage Gaps tab listing open gaps with their status filter and the Draft the answer action
For each gap, Draft the answer has the AI write an article starting point - a structured outline with the question phrased the way customers ask it and clear placeholders for the details only you know. The draft lands in Training > Suggestions, where you complete and approve it before it enters your knowledge base; nothing is published automatically. You can also mark a gap Addressed (you covered it yourself) or Dismiss it (not worth covering).
To keep the list reviewable, DeskClone records at most a few gaps per conversation and pauses recording entirely past 200 open gaps - the page tells you when that happens and recording resumes as you address or dismiss gaps.
For teams that want to go deeper, DeskClone also records which tools your agent used, how confident it was, why conversations escalated, and any guardrail activity - useful once you have real traffic and want to understand how your agent reaches its answers.
The Improvement Loop
Quality grows with a simple weekly habit:
- Skim conversations and the flagged ones for patterns
- Fill the top coverage gaps
- Tweak the personality if the tone is off
The first few weeks move the needle the most. Keep at it and your agent gets noticeably better at your specific visitors and topics.
You don't even have to remember to check: on paid plans, DeskClone emails you a weekly business summary of these numbers - volume, resolutions vs escalations, and the trend against the week before (Pro and above add multi-week trends, open knowledge gaps, and a "what customers asked about" topics list). Turn it on or off under Settings > Notifications (Workspace Settings).
What's Next
To invite teammates and set who can see and do what, head to Team and Permissions.
Was this page helpful?